How NASA is using satellites to track glacier melt, predict sea level rise


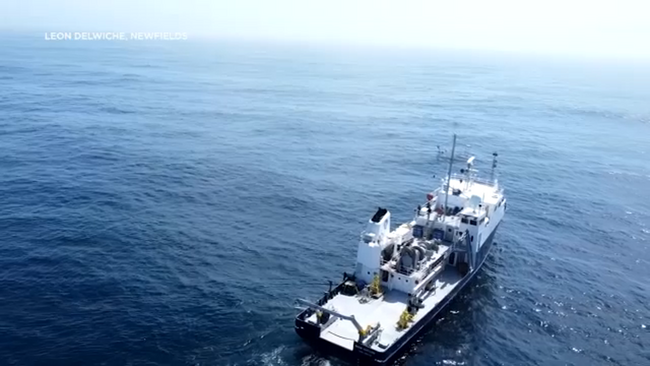
SAN FRANCISCO (KGO) -- For decades, researchers from the NASA Jet Propulsion Laboratory in Pasadena have been studying melting glaciers from sea level to space. Recently launched satellites, like the Sentinel-6 Michael Freilich, are providing precise measurements of changes in the height of the world's oceans. Meanwhile, other satellite-based technologies are measuring the shrinking ice sheets themselves.
"There's ways to measure gravity. So you can actually see the mass of the ice through how much gravity it has, which is an amazing and astounding way to look at the ice sheets," says Nicole Schlegel, a glaciologist on NASA-JPL's Ice Sheet monitoring team.
She says measuring the surface height of the ice can also tell researchers if the sheet is losing mass. In a recently released study of Greenland and Antarctica, the team found that the melting increased by five times in roughly the last 30 years.
MORE: NASA takes research to the sky and sea to track impacts of climate change. Here's how
"And so together, the ice sheets are now contributing five times the amount of sea level that they did back in the 1990s. And together, they're contributing more than 25% of all the sea level contribution that's happening," Schlegel said.
And with its increasing ability to measure both glacier melt and sea level rise, NASA is hoping to more accurately predict what the future may hold. Ben Hamlington leads NASA-JPL's Sea Level Change team. Recently, the group has helped unveil an interactive mapping tool available to the public. It not only projects potential sea level rise, but its effects on a local community.
"So with this tool, you can take the information about long-term sea level rise that we know is happening because of climate change, and connect that to the number of high flood flight days you expect to see in the future at any particular location along the coast," Hamlington said.
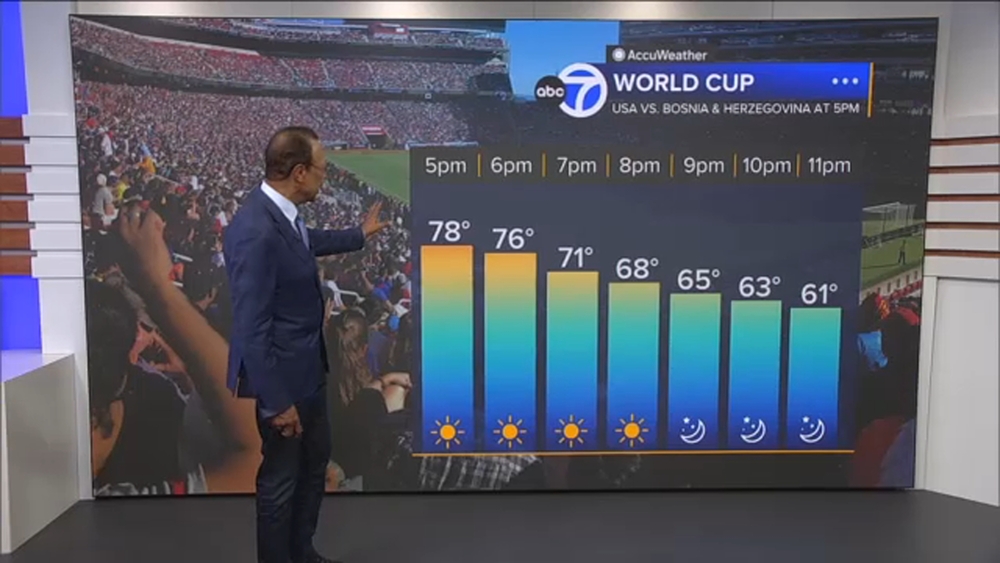
For San Francisco, in roughly 30 years, that could translate to dozens of potential flooding events per year. While projections could change, NASA says one of the key goals is to provide local communities with planning tools for future spending.
MORE: Bay Area Dutch Slough tidal restoration project creates powerful carbon sink, combats climate change
David Lewis is with the environmental group Save the Bay and sees the data as both an opportunity and a wake-up call.
"Until cities and counties are actually using this data and required to plan for sea level rise, the risk will keep growing," Lewis said.
The NASA team is committed to working to ensure the data is translational, and can help inform key decisions -- and possibly help better prepare coastal communities and regions like the Bay Area, for the challenges ahead.
Access the NASA sea level rise tool here.